Agent Debugger Docs
Usage
Captures OpenCode sessions to view them in Agent Debugger
Why Use Agent Debugger
Agent debugger gives you a session record you can come back to when you want to understand what changed, why the run cost what it did or where the agent spent most of its time. The cost overview helps you see usage at a glance across captured sessions split across models not just one run. That makes it easier to spot expensive workflows, compare sessions and models used and understand how agent usage adds up over time.
What you need
- A Distlang account at
dash.distlang.com - OpenCode installed and configured
- Access to update your OpenCode config file
1. Install the OpenCode plugin
Run the installer:
curl -fsSL https://distlang.com/agent-debugger-opencode | bashThe installer sets up the Distlang OpenCode plugin and command shortcuts. Uploads start only after you sign in with /distlang-start.
What the installer changes
- adds the Distlang OpenCode plugin to your global OpenCode config
- creates command shortcuts for signing in, checking status, stopping uploads, and opening the current session in the dashboard
- backs up your existing OpenCode config before changing it
- skips anything that is already installed
After a session is captured, /distlang-view opens the matching Agent Debugger session in your browser.
2. Start OpenCode and sign in
Run OpenCode from a project directory:
opencodeInside OpenCode, run:
/distlang-startIf you are not signed in, /distlang-start opens the browser login flow and enables Agent Debugger uploads after auth succeeds.
The plugin observes OpenCode sessions and uploads captured session, interaction, and step records to Distlang Agent Debugger. If auth is missing, the plugin shows a warning and continues without uploading.
Auth and Local Session
Agent Debugger uses your Distlang account sign-in. You do not need to paste an API token into your OpenCode config.
When you run /distlang-start, the plugin opens a browser sign-in flow if you are not already signed in. After sign-in succeeds, a local session is saved on your machine so future OpenCode sessions can upload to Agent Debugger without asking you to sign in every time.
The local session uses short-lived access tokens. Access tokens currently expire after about 15 minutes, and the plugin refreshes them automatically while your local session is still valid.
Uploads only start after /distlang-start enables them. To stop uploads and clear the local sign-in session, run /distlang-stop.
This is separate from Metrics API tokens. Agent Debugger uses your signed-in Distlang account session, not a long-lived API token copied into config.
To view the captured sessions use
/distlang-viewUpdating or Removing
To refresh the OpenCode setup later, run:
curl -fsSL https://distlang.com/agent-debugger-opencode | bash -s -- --updateThis keeps the plugin entry in your config and rewrites the Distlang command shortcuts. The default plugin entry uses the latest npm package when OpenCode starts.
If you need a specific plugin version, set DISTLANG_OPENCODE_PLUGIN while updating:
curl -fsSL https://distlang.com/agent-debugger-opencode | DISTLANG_OPENCODE_PLUGIN='@distlang/opencode-plugin@1.2.3' bash -s -- --updateRestart OpenCode afterward if it is already running.
To remove the OpenCode integration, run:
curl -fsSL https://distlang.com/agent-debugger-opencode | bash -s -- --uninstallThis removes the Distlang plugin entry and command shortcuts. It also backs up your OpenCode config before changing it.
Manual Setup instructions
If you prefer to edit the files yourself, add the Distlang plugin to your global OpenCode config:
~/.config/opencode/opencode.json
{
  "$schema": "https://opencode.ai/config.json",
  "plugin": ["@distlang/opencode-plugin"]
}
OpenCode installs npm plugins automatically with Bun at startup.
Then add the Distlang commands.
OpenCode commands are configured separately from plugins. Add these command files so you can sign in and manage uploads from inside the OpenCode TUI:
~/.config/opencode/commands/distlang-start.md
---
description: Sign in and enable Distlang Agent Debugger uploads
---
~/.config/opencode/commands/distlang-stop.md
---
description: Disable Distlang Agent Debugger uploads and sign out
---
~/.config/opencode/commands/distlang-status.md
---
description: Show Distlang Agent Debugger upload status
---
~/.config/opencode/commands/distlang-view.md
---
description: Open the current Agent Debugger session in the browser
---
The plugin handles:
/distlang-start/distlang-stop/distlang-status/distlang-view
The legacy compact command also remains supported:
/distlang status/distlang start/distlang stop/distlang login/distlang logout
Distlang commands
Run these inside the OpenCode TUI after adding the command files:
/distlang-start
/distlang-status
/distlang-view
Commands:
/distlang-status: show whether uploads are enabled, whether auth is available, and whether recent Agent Debugger sessions are visible/distlang-start: sign in if needed and enable Agent Debugger uploads/distlang-stop: disable Agent Debugger uploads and sign out of Distlang/distlang-view: open the browser to the Agent Debugger session for the current OpenCode session, or the Agent Debugger overview when no session is available yet
Legacy aliases remain available: /distlang status, /distlang start, /distlang stop, /distlang login, and /distlang logout.
3. Open Agent Debugger
Go to dash.distlang.com and open Agent Debugger.
The sessions page shows recent captured sessions. Use the time controls to filter sessions by preset ranges like 24h, 7d, or 30d, or enter a custom start and end time.
Open a session to inspect:
- session status, duration, cost, token totals, and context growth
- the session timeline across captured interactions
- the interaction timeline for the selected interaction
- step details, tool calls, file edits, and LLM context breakdowns when available
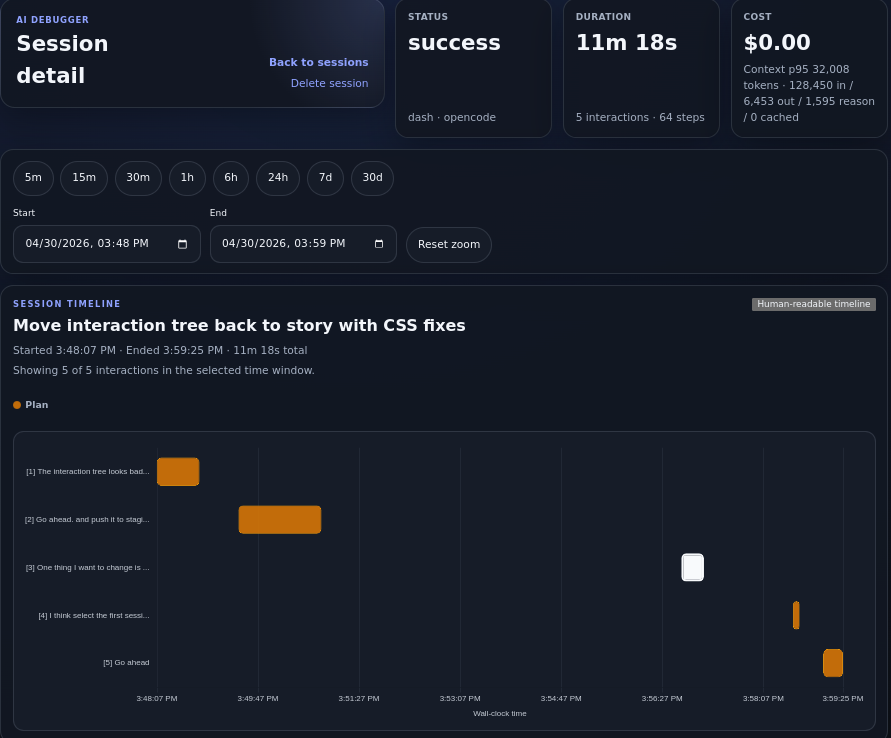
The session detail page gives you the whole run at a glance: status, duration, cost, token totals, time controls, and the captured interaction timeline.
Timeline zoom
The session detail page supports dashboard-style time filtering:
- Choose a preset range from the toolbar
- Enter custom
StartandEndtimes - Drag across the session timeline to zoom into a specific time region
- Click an interaction bar to load that interaction below the session timeline
- Use
Reset zoomto return to the full session range
Dragging only zooms after intentional pointer movement, so normal clicks still select interactions.
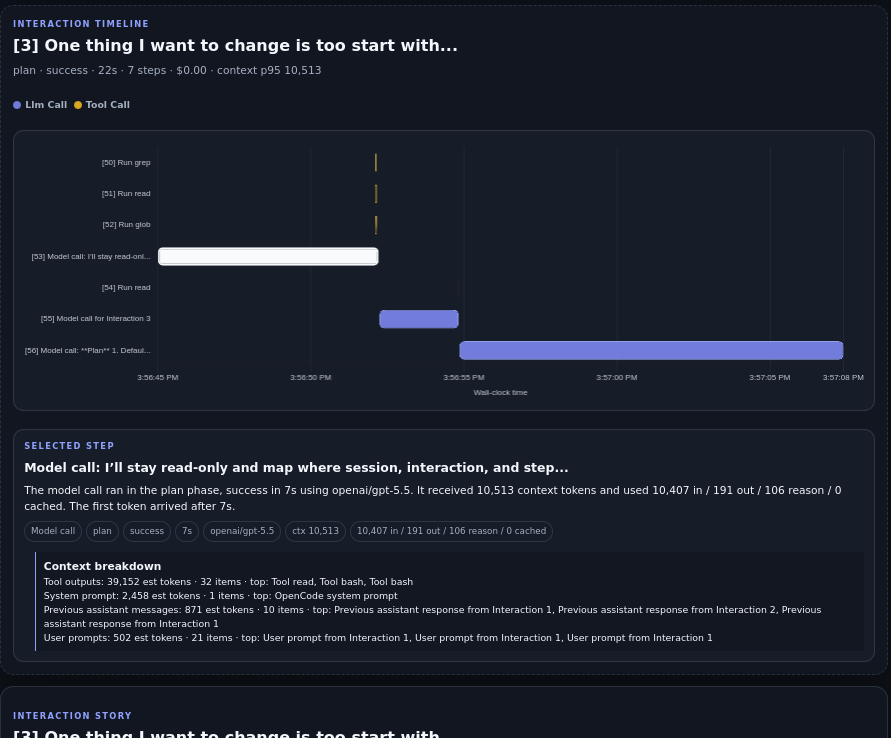
After selecting an interaction, Agent Debugger shows the lower-level step timeline and the selected step details, including model call metadata and context breakdowns when available.
Troubleshooting
Enable plugin debug logging when you need to inspect startup, auth, or upload behavior:
DISTLANG_OPENCODE_DEBUG=1 opencodeUseful overrides:
DISTLANG_BIN=/path/to/distlang opencode
DISTLANG_STORE_BASE_URL=https://api-staging.distlang.com opencode
DISTLANG_AUTH_BASE_URL=https://auth-staging.distlang.com opencode
DISTLANG_OPENCODE_LOG_FILE=/tmp/distlang-opencode.log opencode
To confirm uploads are visible after a run:
distlang helpers request GET /agent-debugger/v1/sessions --jsonIf uploads are not appearing, run /distlang-status inside OpenCode first. It reports whether uploads are enabled, whether auth is available, and whether recent Agent Debugger sessions are visible.
To stop future uploads and clear your local Distlang auth session, run /distlang-stop inside OpenCode.