Send agent sessions to Agent Debugger
Distlang Agent Debugger captures OpenCode and Claude Code sessions so you can inspect what happened after an agent run: prompts, model calls, tool calls, file edits, context growth, cost, and timing.
Install the integration for your agent tool, run one slash command, and your sessions start appearing in the hosted dashboard.
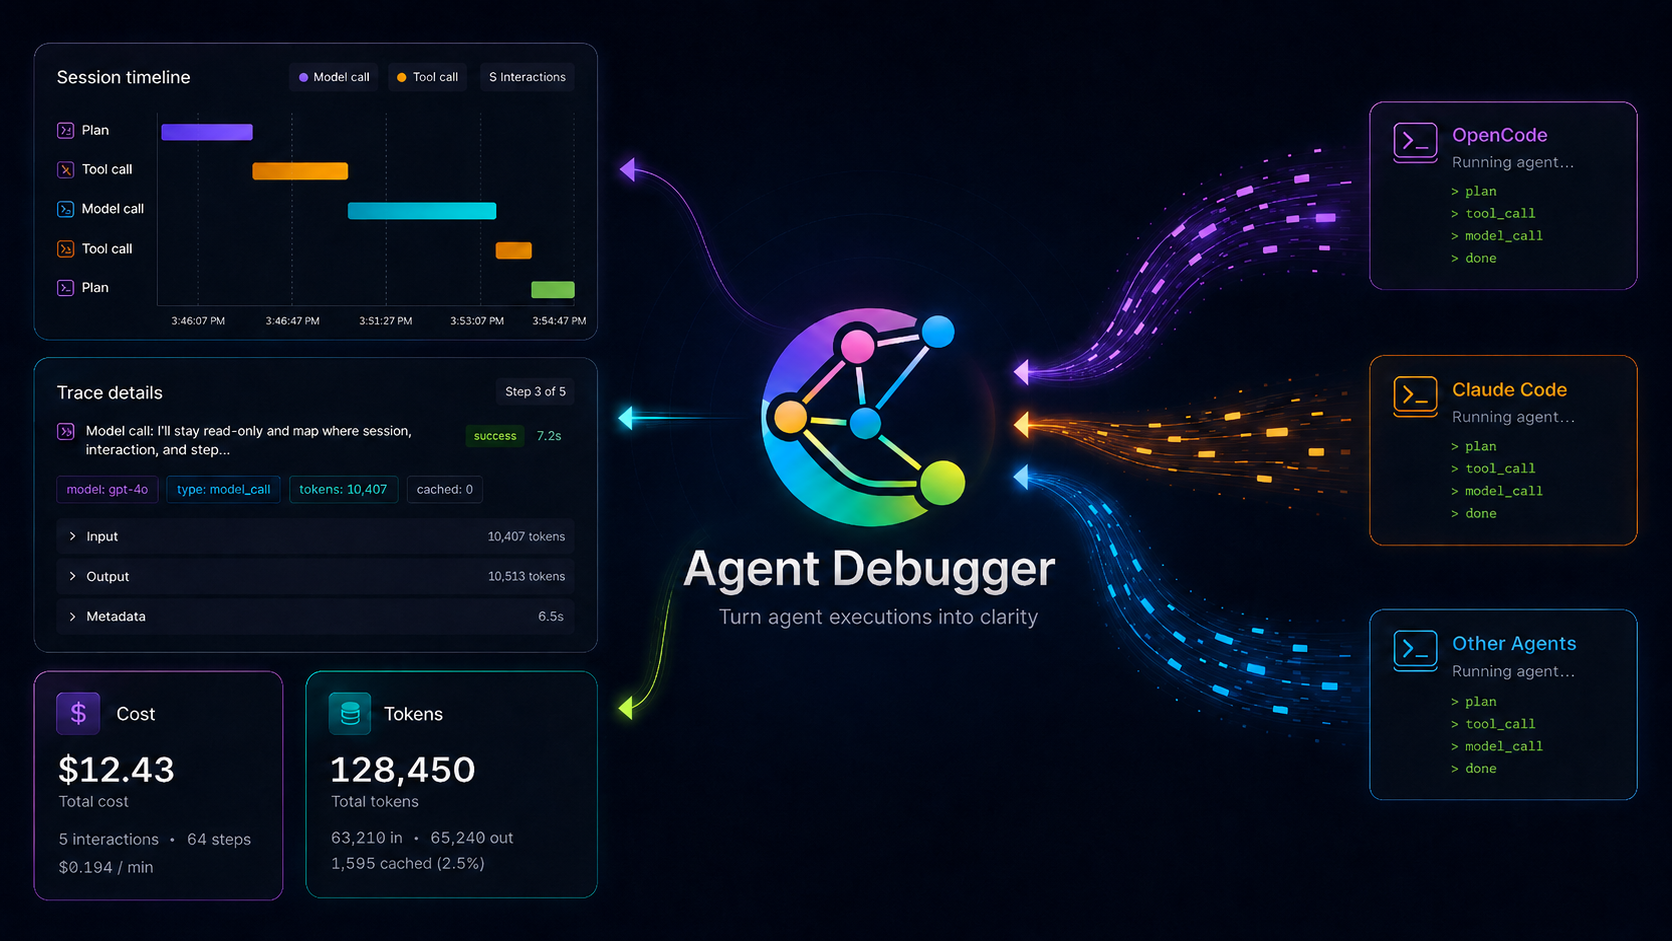
Use Agent Debugger as the shared timeline for agent sessions across your local coding tools.
1. Install the OpenCode plugin
Run the installer to add the Distlang plugin and command shortcuts to your OpenCode config:
curl -fsSL https://distlang.com/agent-debugger-opencode | bashThe script backs up your existing config, adds shortcuts for start, status, stop, and view, and skips anything already installed.
2. Start OpenCode and sign in
Run OpenCode from your project, then run this inside the OpenCode TUI:
/distlang-startIf you are not signed in, the plugin opens the browser login flow and enables uploads after auth succeeds.
After a captured run, use this command to open the matching Agent Debugger session in your browser:
/distlang-viewThat is it. Your next OpenCode sessions are captured, and /distlang-view can take you back to the matching session or the Agent Debugger overview.
Update or remove later
Run the installer again with --update to refresh the OpenCode setup, or --uninstall to remove the plugin entry and Distlang command shortcuts.
curl -fsSL https://distlang.com/agent-debugger-opencode | bash -s -- --update
curl -fsSL https://distlang.com/agent-debugger-opencode | bash -s -- --uninstall
1. Install the Claude Code hooks
Run the installer to add the managed Distlang package, Claude Code hooks, and slash commands:
curl -fsSL https://distlang.com/agent-debugger-claude-code | bashThe script backs up your Claude Code settings, installs the plugin package, and configures Distlang-managed lifecycle hooks.
2. Start Claude Code and sign in
Restart Claude Code if it is already running, then run this inside Claude Code:
/distlang-startYou can also use /distlang-login to sign in. Once auth succeeds, Claude Code hook events upload to Agent Debugger best-effort without blocking your session.
After a captured run, use this command to open the matching Agent Debugger session or the Agent Debugger overview:
/distlang-viewClaude Code does not expose every exact token field through hooks, so Agent Debugger records the available lifecycle, tool, transcript, and aggregate usage details.
Update or remove later
Run the installer again with --update to refresh the managed package and hooks, or --uninstall to remove the Distlang Claude Code integration.
curl -fsSL https://distlang.com/agent-debugger-claude-code | bash -s -- --update
curl -fsSL https://distlang.com/agent-debugger-claude-code | bash -s -- --uninstall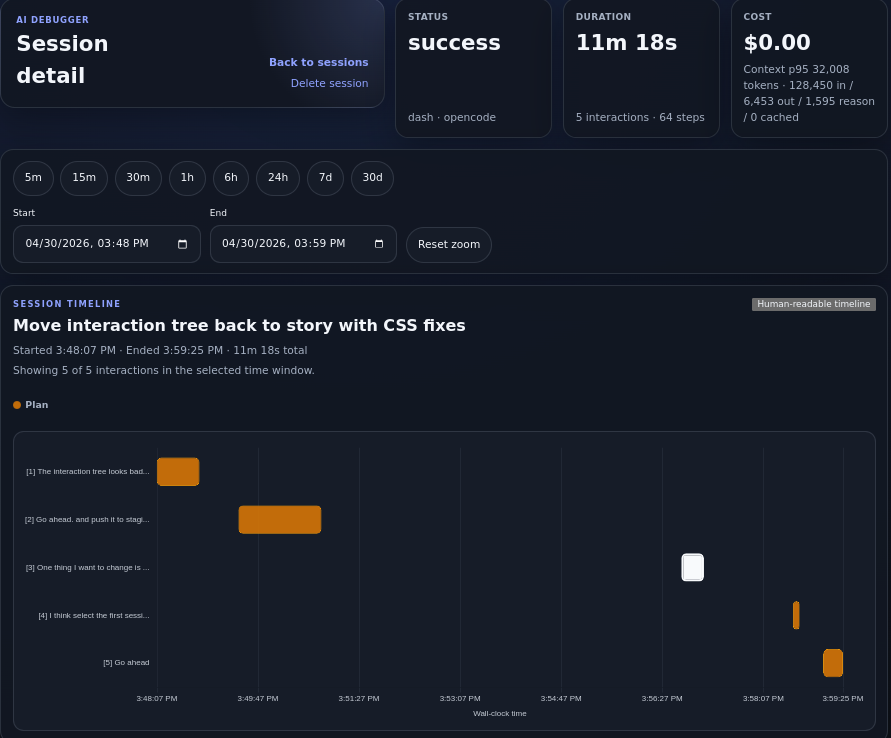
Review the full run timeline, duration, cost, token totals, and captured interactions in the dashboard.
Open any interaction to see the lower-level timeline and selected step details, including model metadata, tool calls, file edits, and context breakdowns when available.
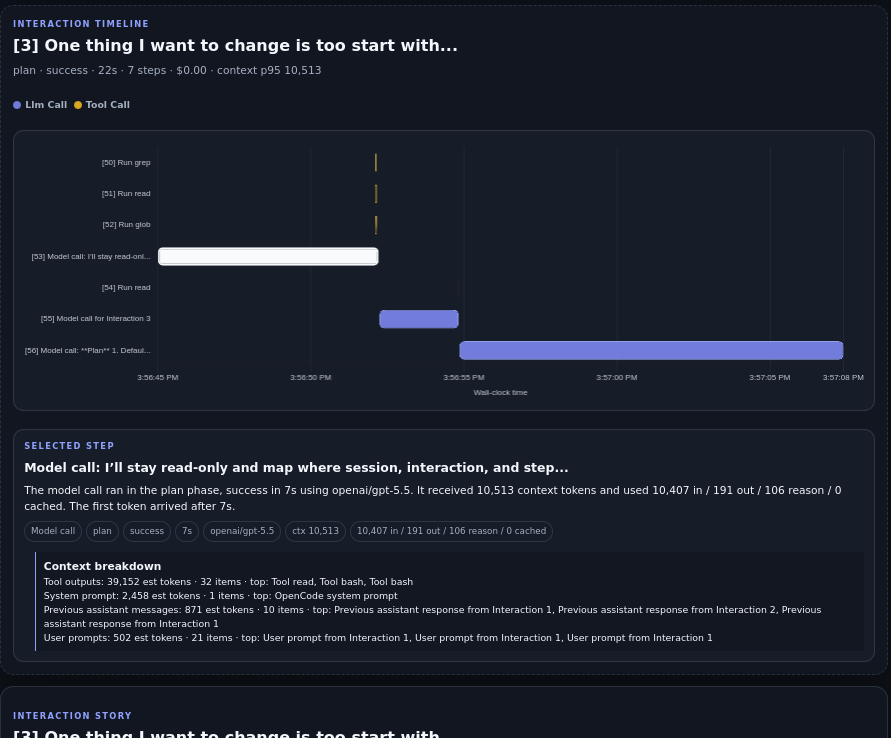
Drill into an interaction to understand how the agent used context and tools.